|
|
|
|
Ted's Stock Trading Page
I'm a very active trader - when the market is doing well. I subscribe to William O'Neil's Daily Graphs Online. Every day I download stock data from this web site and merge it into an Microsoft Access database I've developed over the last four years. From this database I select a list of stocks to investigate further. I really like the stock charts Daily Graphs Online gives me.
Below is my portfolio performance for the last five years as well as how my portfolio has done year-to-date this year.
| Year
1998 1999 2000 2001 2002 2003 |
Gain 58% 59% 6% -1% -2.5% -3.0% |
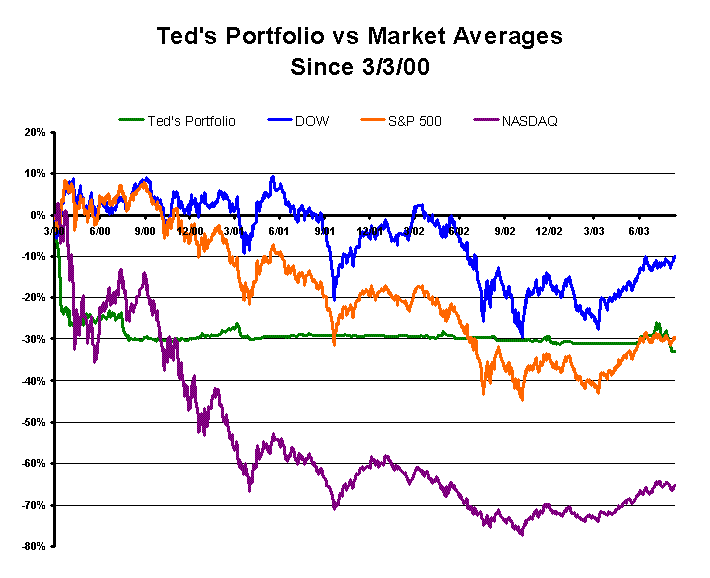
My portfolio reached it peak on March 3, 2000 - my birthday! It's been all downhill from there. My portfolio is currently about 33% below the March 3, 2000 peak. Here's how I've done.

I'm down to 8% invested. Here's how my current portfolio is doing.
Stocks
|
|
Gain/Loss |
|
|
|
This Week |
Last Week |
|
BSX |
-2.66% |
|
|
|
||
As you can see I only own one stock. I put a buy order in for this one and it triggered the next day. Unfortunately, the stock tried to break out, but it failed. In addition, the attempted breakout was on low volume. It was actually down a bit more, but has partially recovered.
You can see that my fund as not done well either.
Funds
|
|||||||||||||||
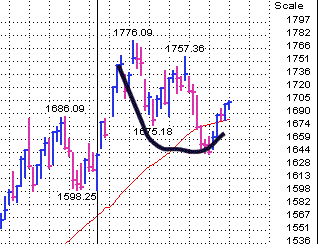
I've noticed that the market in general is going through a malaise. What I find interesting, is the market appears to be mapping out a traditional cup-and-handle formation. Here's a snippet of the NASDAQ.

The thin read line is the 50 DMA. Dropping below the 50 DMA is not a good sign. The squiggly black line is my attempt to draw a curve of the action over the last six weeks. It looks to me like it's starting to trace out the right side of the cup part. Or this could be a double-bottom formation. Either way it is a potential bullish sign and could bode well for the future.
I would say that now the time to keep your powder dry, but be ready, the market could finish out this pattern over the next couple of weeks and then take off again - or it may not.
It will pay to keep a close eye on stocks that might be basing and be ready to pull the trigger, when they break out.
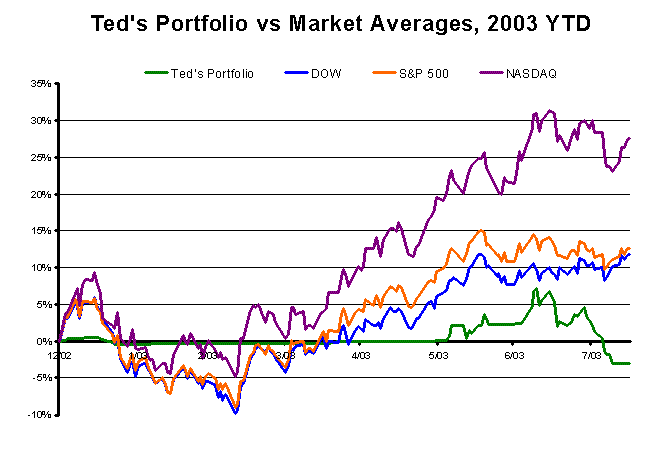
Here's how I'm doing year-to-date.

Had any really profitable trades lately? Share them with me. I'd love to hear about your successes.
So, let me just say, happy trading to you,
until we meet again!
Warmly,
Ted
Posted 8/16/03

